CloudWatch Logs
3 minute read
Background
CloudWatch Logs is AWS’ managed logging service. Many AWS services stream logs directly into CloudWatch Logs, for example, Lambda, *LBs, CloudTrail, etc. Because it is API driven, external services and applications can also send logs to CloudWatch Logs.
How We Use It
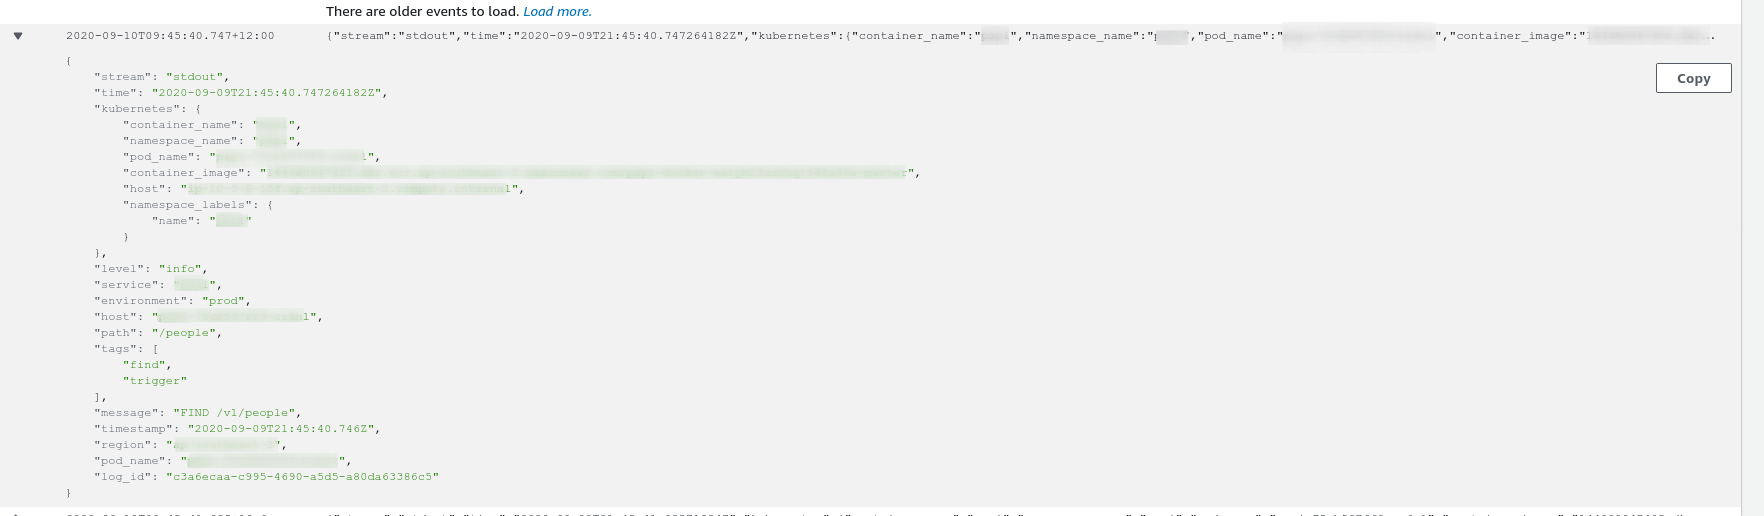
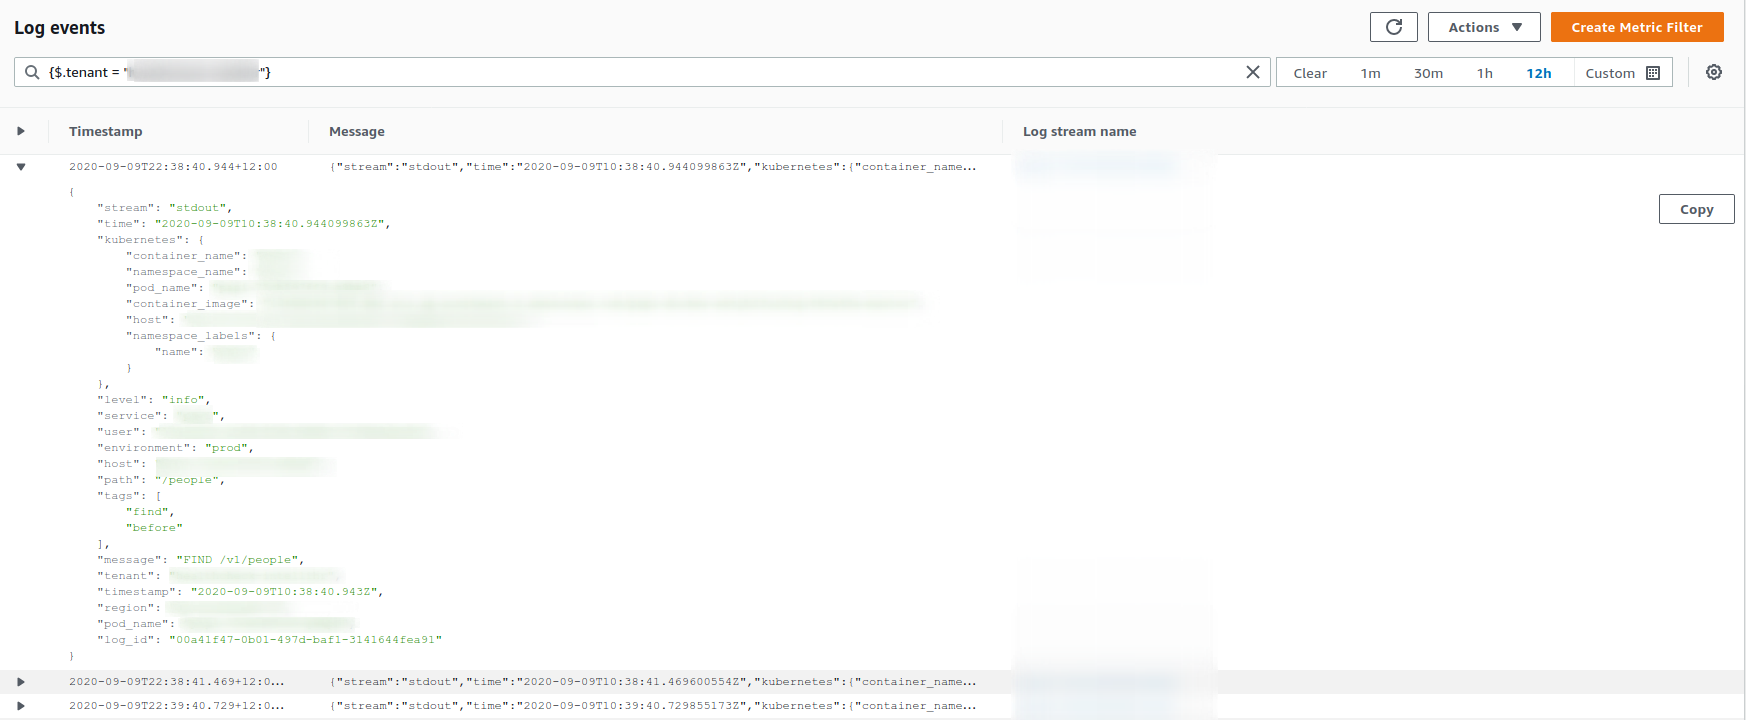
When a service does a logging action, a logging agent that monitors the log file will send the log to CloudWatch Logs. It is then viewable in the AWS CloudWatch Logs console for the specific AWS account. An example log is shown below.
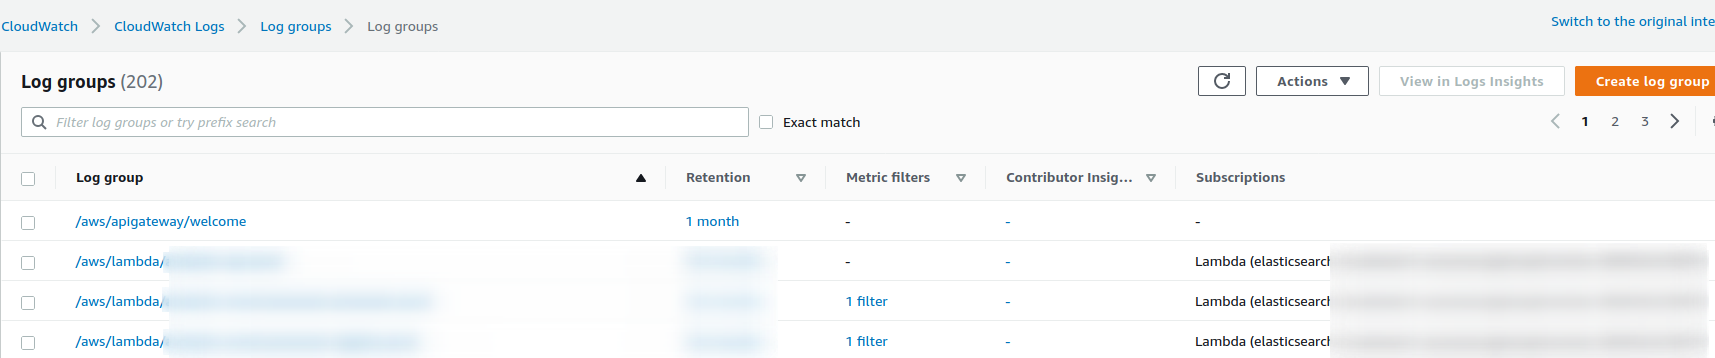
Log Groups
CloudWatch has the concept of log groups. A log group is unique per service or lambda function. Inside each log group can be many log streams, and inside each log stream are the logs. Log have a number of options available to them, for example, event subscriptions, log retention and metric filters. These options will be explored later in the document.
Log Streams
Inside a log group is a log stream. A group can have many log streams, for example, each individual Lambda instance will have its own log stream. Similarly, each individual “pod” in a Kubernetes deployment will have its own log stream that’s name will coincide with the pod name. Log streams can be tailed and queried.
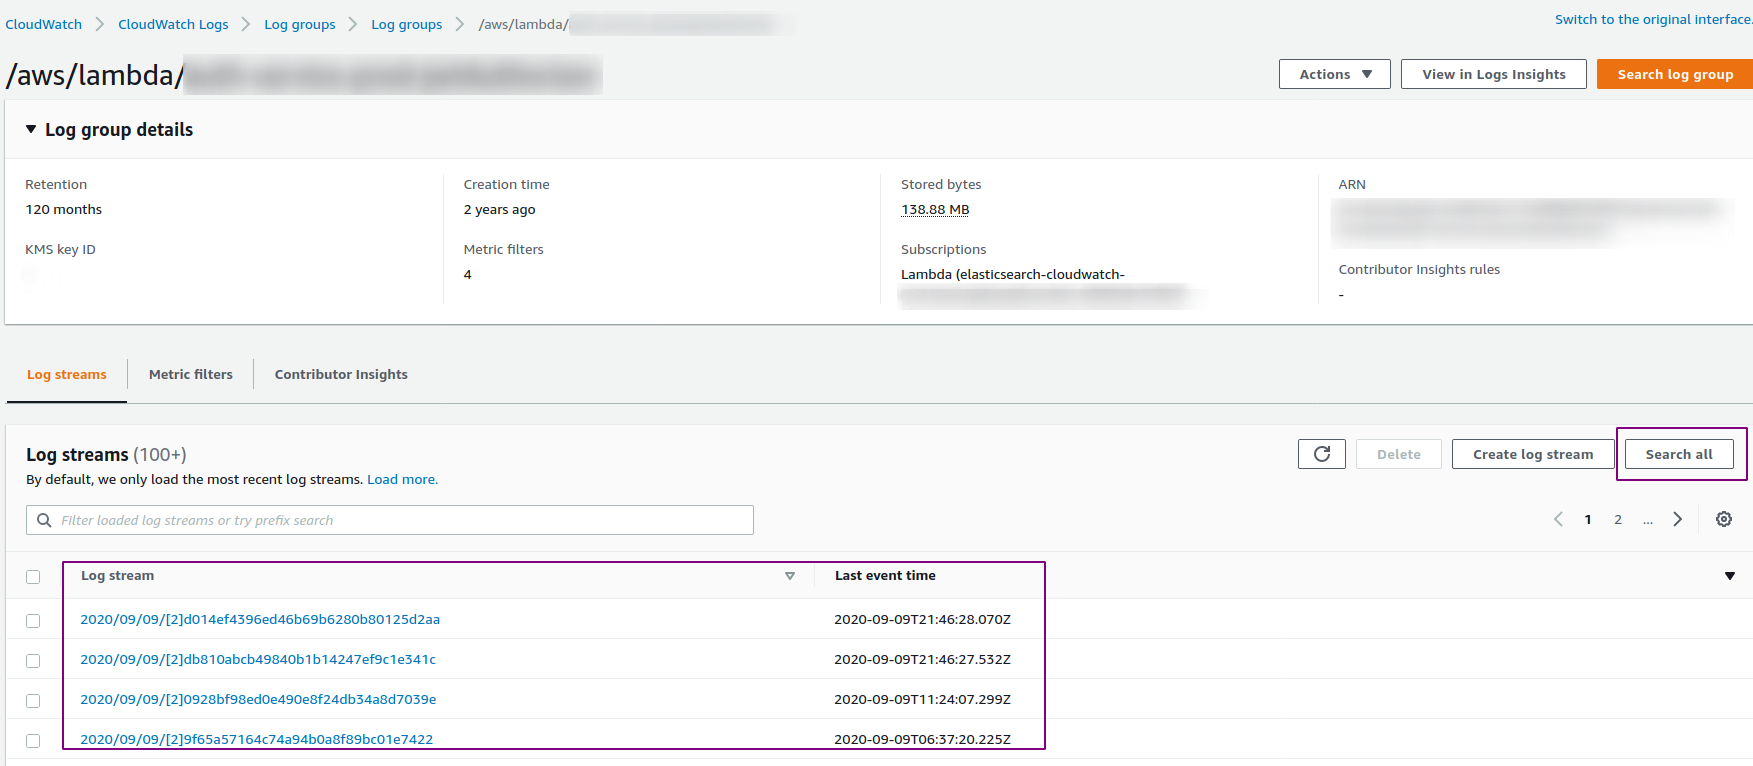
Querying a Log Stream
A log stream, or streams can easily be queried inside the CloudWatch Logs console. Individual search terms can be queried, for example,"502" or if the log is in JSON format then specific JSON elements can be queried. For example, to search for logs for a specific tenant (assuming the service logging the data logs correctly), the query {$.tenant = "logging-test"} would be used. For full documentation on the query language, visit the Filter and Pattern Syntax section of the AWS CloudWatch Logs documentation.
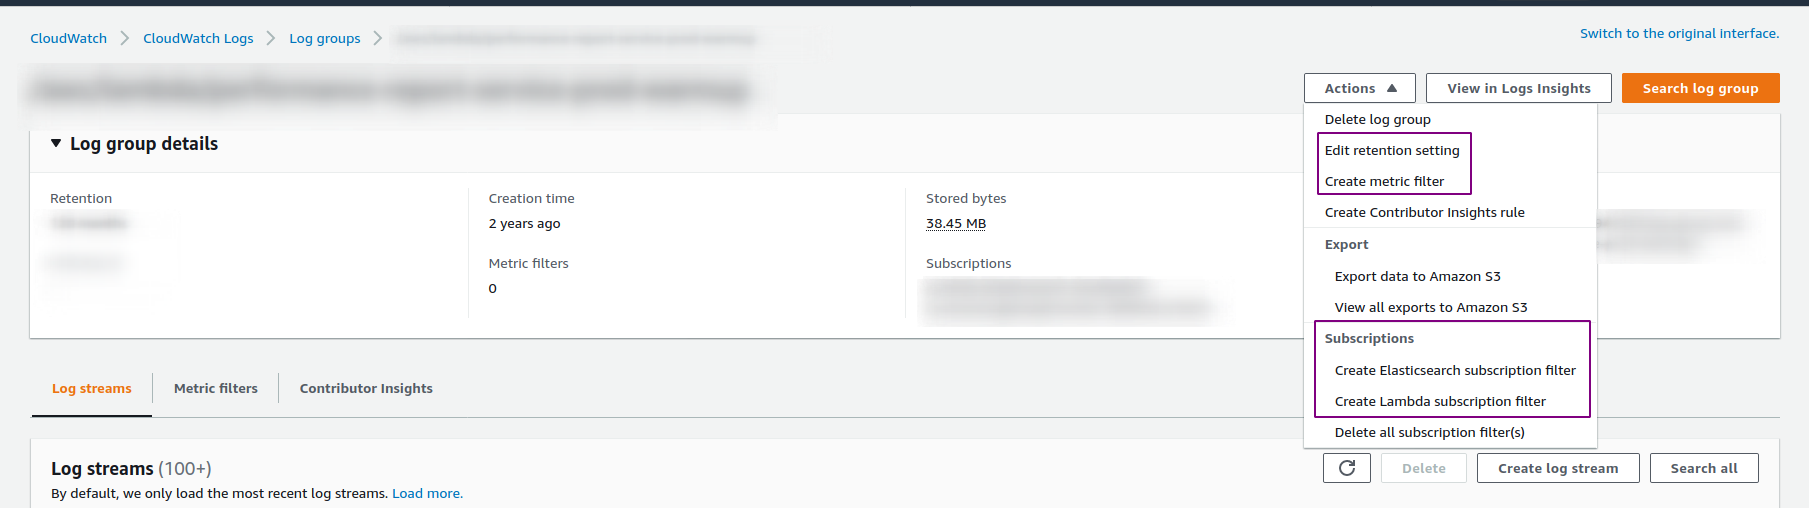
Event Subscriptions
CloudWatch log groups can have event subscriptions attached to them. At present time the following subscriptions are supported: Elasticsearch and Lambda.
When a log stream receives a new log, the log group will trigger a subscription and send a payload to the event subscription endpoint. For example, if using AWS managed Elasticsearch with the Elasticsearch subscription, when a new log entry is created in the log stream, the log will also be sent to Elasticsearch.
Metric Filters
Metric filters are CloudWatch metrics that are created based on matching patterns in a log. For example, a metric filter could be created that monitors a log group for a log containing ${.level = "error"}. When a log is created with the level of error, a CloudWatch metric will be created with a value defined in the filter. A CloudWatch alarm can then be configured to notify Slack that there has been an error with the service.
Log retention
Log retention can be configured to limit the amount of data stored in a log group. At present, intelliHR is keeping 1 month of logs in CloudWatch.